Abstract
In an age of hyperpolarization in the United States, understanding the underlying aspects involved with this political divide is ever more important. One of these aspects directly involves the politics of gender. Women have just recently been given a seat in traditional male dominated environments, politics being one of them, yet in the 2016 presidential election, we witnessed one of the most dramatic performances of sexism strategically used among the candidates. With the support of sociological theory and external sources, this paper analyzes 2018 GSS Survey Data to synthesize the American public opinion on women in politics. By cross testing these public opinions with the 2016 election, I attempt to see if there is an association between these political candidates and the public’s opinion of women in office. Further, I cross reference these variables with sex, race and degree to analyze the data further and gain more detailed information about who holds these opinions. The results found that across the entire sample, the majority of respondents disagreed that women were unsuitable for politics. Nevertheless, among every variable, there were groupings that showed statistically significant differences in the data that indicate opinion trends among people of a certain political party, sex, race and educational degree.
INTRODUCTION & THEORETICAL FRAMEWORK
In this research I will be examining the opinion of Americans on whether men are more emotionally suited for politics than women.
This is important because in the United States and countries around the world, there have been gender roles that restrict certain
people from being socially accepted, attaining achievements or filling positions in the world. Politics is a great example of a
field in which women are not generally accepted. Though the US government has recently had more diversity after the 2018 midterm
elections than ever before, the social acceptance of women in political roles is still slightly taboo. This research question
examines how much of America still follows these gender role expectations, where they believe that women are too emotional to be
effective politicians. As a result of this investigation, we can be more proactive in educating and reassuring Americans that women
are equally as qualified as men to be in politics. With the analysis of the data, we can figure out what groups of people hold this
bias, and therefore will give us insight into who should benefit from educational programs or in female running political campaigns,
we can understand who to campaign to, and who not to.
I arrived at this topic by searching through the SPSS code book. As someone who has grown up in the Washington DC area, politics
has always been interesting to me. Especially since the past 2016 presidential election, like many other people my age, I was finally
able to participate more in the political scene. For these reasons, I felt particularly compelled by this question, not only because of
my political activity, but my identification as a woman who considers going into the political field in some way or another.
I will be corroborating my research with Simone de Beauvoir’s theory of women as the other. Here, she argues that society sees a woman as
the negative inverse to the positive man, with whom everything is centered around. She says that this automatic negative connotation given
to women not only alienates them but “limits her without reciprocity,” (de Beauvoir, 268). Further, the assumptions made upon women are that
their actions and decision making is deduced down to the singular fact that she is a woman, rather than her individual qualities and decision
making. This directly ties back into my research by understanding the question at hand: are men more emotionally equipped to be in politics
than women. Assuming that women are not emotionally capable of political endeavors puts an immediate assumption and limitation on women overall
without taking into consideration any other factor of who they are as a person and worker. Therefore, with this theoretical framework, we will
be able to understand this question better in relation to those who agree and disagree with the statement.
PROBLEM & PURPOSE
I. Statement of the Problem
This election had incredible impacts on modern politics, for multiple reasons, one of which being the rejuvenation of open and acceptable harassment
of women in politics, as we saw from Donald Trump with his presidential opponent Hillary Clinton. Though Clinton had run previously against President
Barack Obama, the cruel severity of the election brought out extreme negative sentiments about Clinton’s womanhood, making her seem under qualified to
be president. Furthermore, in light of what I will be investigating, the public opinion around men being more emotionally capable of handling a
profession in politics and seeing as Trump used this anti-female sentiment as a political strike against Clinton, it is worth seeing how Americans
reacted to it. I am here to investigate by how much this sentiment against women in politics exists, and among whom. More specifically, I want to see
if this is a problem that is significant enough to bring a bias into future voting decisions. If so, where is the majority of these people who hold
this sentiment? Are they associated with specific identities such as religious affiliation, race, political party, etc? I plan to analyze this by
looking at the central tendencies for my correlation variables in regard to my dependent and independent variables, as well as the variation of the
same variables in order to find numerical correlations or patterns that would suggest valuable information about the sample population.
II. Purpose of the Study
In the fields of Anthropology and Sociology, the study of gender relations in society has always been a topic of importance because it is one of the
core topics of inequality and hierarchy. More specifically, by looking at opinions of gender and politics, we can access these core beliefs about
gender relations and the traditional patriarchal aspects of society through the political scene. For example, in the United States, there are many
industries that are either dominated by men or by women. The service industry is usually dominated by women and banking and investment is usually
dominated by men. Politics is one of the industries that is traditionally dominated by men and has been a struggle for women to wheedle their way
into for many reasons, one of which is the societal idea that women are too fragile to participate in politics. Though that opinion has been slowly
shifting as more women successfully take positions in male dominated spaces, the existence of this gender hierarchy and misconceptions of women
continues to exist.
III. Significance
Not only can this project give information about how biased our voting base is about women in politics specifically, but it can also tell what
communities still hold traditional viewpoints on a larger scale. In other words, though this project will not directly contribute to other belief
systems, this could be one part of the puzzle piece of inequalities in the United States and who are the people who are encouraging or participating
in maintaining these inequalities. In addition, if this research were to be valuable or usable in other contexts, it could contribute to political
campaigns as a reference point for polling and finding a voter base. For example, if a female senator needed polling information about where to campaign
and to whom to campaign, this could help steer them in certain directions based on inherent biases that we know some Americans hold.
LITERATURE REVIEW
Though it may be hard to hypothesize whether there are associations between gender politics and individual identities, one study corroborates
the existence of this relationship. By looking directly at 14 women running for office across the United States, especially Democrats who were
running on grounds of being a woman, the voters who were women were more likely to vote for women, (Pultzer & Zipp, 1996). In other words, there
was an association between the identity of the voter and the identity of the person running for office, especially when they broadcasted their
identity as part of their platform. This is important because we can understand that there is a relationship between voting habits and identity.
In reference to my research, this is significant because it means that my controls have a higher probability of having some influence on opinion
of gender and politics. Interestingly enough, this pattern can be found when uninformed voters chose a candidate without any information about
them, other than their name, (Crowder-Meyer, Gadarian, & Trounstine, 2020). In a 2020 study, researchers set out to see if there would be biases
among individuals if they lacked information about the candidate’s profession or background. They found that indeed, individuals were chosen
based on their names, and were judged on their race, gender and ethnicity solely by the sound of the name. This suggests that inherent biases
exist among voters even if they are not informed about the candidate. In other words, it is possible that some voters are choosing men over women
simply because of their gender.
In regard to women and men entering into politics, and the overall stigmas surrounding the profession, we know that women are less likely to be
involved in politics solely because of their gender (Cavazza & Pacilli, 2021). In a 2021 study, researchers set out to see if politics was still
a masculine environment. They found that because politics is so male dominated, it made women more hesitant to become involved in the profession,
though it did not inhibit them from voting. This is direct evidence that there are existing stigmas around gender and politics. Moreso, that
politics is directly associated with masculinity, and therefore is harder for women to fit into that environment. This is important because it
recognizes that the stigmas around gender and politics could, and most likely does reach out to voter bases as well.
Finally, it is important to understand more about the 2016 election and how that influenced the perception of women in politics. Our understanding
of how Trump got elected is important because it is tied directly to identity politics (Lynch, 2019). For example, in a 2019 study of this topic,
researchers concluded that Trump’s base was directed around identity politics, directly associated with the Midwest, and therefore had a large impact
on those voters and how we see presidential voting today. Furthermore, a 2018 article analyzing national election studies and self-conducted surveys
not only confirms the importance of identity politics in the 2016 election, but the strength that sexism had in determining the outcome (Valentino,
Wayne, & Oceno, 2018). They argue that the underlying parts of sexism enforced by Donald Trump were enforced by the power of anger instead of fear.
Finally, a 2021 study around the 2016 presidential election and how masculinity shaped voting behavior found that there was a direct correlation
between Trump as a presidential candidate and gendered voters, specifying the importance of masculinity (Deckman & Cassese, 2021). This is all to
note that there are inherent biases that parallel with voting habits, and that especially during the 2016 election, there were direct correlations
with masculinity and voting decisions.
RESEARCH QUESTION & HYPOTHESIS
In my research I would like to examine how political affiliation, specifically the 2016 election, affects attitudes about women in politics. More specifically, whether
respondents believe that men are more emotionally equipped for politics than women. The controls that I will examine that could possibly affect the outcome of this general
opinion will be sex, race and level of educational degree. In regard to political affiliation in the 2016 election, I expect to see that individuals who voted for Donald
Trump are more likely to think that women are not emotionally equipped for politics, whereas respondents who voted for Hillary Clinton believe that men are not more
emotionally equipped for a profession in politics than women. Further, I am expecting to see a difference in opinion in regard to sex, with the assumption that men would
be more likely to think they are more emotionally capable of a political career than the opinion of women. That being said, I do think that I will see a handful of women
in the sample who believe that men are more suitable for politics than women, because of conservative gender role values that have been surprisingly prevalent among the
opinions of women. Finally, I am predicting that there might be a slight difference in opinion across races, due to how certain racial communities tend to lean more
conservatively or liberally in their general values. Nevertheless, I think that there is a possibility that this constant will not be as defining of a factor as the
other constants because there is diversity of opinion among any racial community.
DATA AND METHODS
For this research I will be referring to the 2018 GSS dataset and the 2018 GSS codebook for my data. As explained above, I will be analyzing how the 2016 presidential
election affected the opinions of people in regard to gender and politics. More specifically, whether the 2016 presidential election had an impact on people's opinions
of women being emotionally qualified for a political position. Therefore, my dependent variable is gender and politics. This is analyzed by the GSS codebook survey
question “Tell me if you agree or disagree with this statement: Most men are better suited emotionally for politics than are most women.” The valid answer options for
this question are: 1. Agree, 2. Disagree. Seeing as this is a nominal variable, I will be analyzing the mode for this question, which will tell me which answer was
chosen with the highest frequency.
As seen in table 1.1, we can see that the mode is 2, referring to the second option which is “disagree.” In other words, in the sample of 1,499 adult Americans,
the most commonly reported answer was “disagree,” meaning that more respondents from the sample do not think that men are more emotionally suitable for politics than
women. Nevertheless, 13.8% of the respondents, or 207 out of 1,499, agree that men are more emotionally suitable for politics, therefore, though there is a distinct
majority, there are still people who believe that statement to be true. Additionally, by using a pie chart (figure 1.2), we can see that the majority of the sample
disagree that women are not suited for politics, while a smaller proportion do agree with that statement.
What I want to analyze next is the independent variable and whether it has an effect on the previous question about gender and politics, which is the political views of the
2016 election. Looking at table 2.1, from the 2018 GSS data, “PRES16” is a nominal variable, meaning we will be analyzing the mode. The 2348 respondents had the seven answers
to choose from shown above in figure 2.1. In the 2018 GSS codebook, the question states “Did you vote for Clinton or Trump?” The problem with this mode displayed in the
statistics is that it takes into account all seven answers. Therefore, we can calculate the mode of just the Clinton and Trump options by looking at the frequency of the
two categories. Out of the 2,348 respondents, 764 voted for Clinton and 577 voted for Trump, therefore, the most commonly reported variable is Clinton. Therefore, the majority
of the sample voted for Clinton. Finally, it is important to analyze the controls, which are sex, race and degree achieved. In the 2018 GSS codebook, sex, race, and degree are
not distinct questions, rather notations stating: “respondent’s sex,” “respondent’s race,” and “respondent’s degree.”
Because the variable “SEX” is a nominal variable, seen in table 3.1, the mode is what needs to be analyzed. Out of 2,348 respondents, the most commonly reported variable out of
“male” or “female” was “female” with 1,296 respondents reporting this answer. On the contrary, 1,052 respondents reported the “male” variable. Based on the data in table 4.1,
we will be analyzing the mode because “RACE” is nominal data. Out of 2,348 respondents, the most reported category out of “white” and “black” was 1, meaning that the most
respondents reported being white, with 1,693 individuals answering as such. Conversely, 385 respondents out of the total sample reported identifying as Black. Seeing that
“DEGREE” is an ordinal variable, as displayed in table 5.1, we will be analyzing the mode and the median. In this dataset, out of 2,348 respondents, the most commonly reported
variable out of those listed in 3.3 is 1, meaning that the most respondents reported “high school” as their highest level of education. Additionally, the median is also 1,
meaning that out of 2,348 respondents, half of the sample has a high school degree or lower, and half of the respondents have a high school diploma or higher level of education.
Overall, in order to do further research and tests on the data, I will most likely be using chi-squared tests and comparative frequency tables that combine these variables in order
to get clear results about the relationship between political views from the 2016 election and gender in politics.
RESULTS
In order to understand the results of this project, it is necessary to discuss the dependent and independent variables on their own. The dependent variable, or attitudes
about whether women are emotionally equipped for politics, shows that out of 1,499 adult Americans, 207 (or 13.8%) agreed with the statement that women are not suited for
politics, whereas 1,292 respondents (or 86.2%) disagreed with the same statement (table 1.1 and figure 1.2). This obviously shows that a large majority of Americans do not
agree with the idea that men are more emotionally equipped for politics than women, in contrast with a small proportion who actually do.
Similarly, when looking at the frequency table of table 2.1, which describes the frequency of voting choices in the 2016 presidential election, out of 2,348 adult Americans,
764 (or 32.5%) voted for Clinton, and 557 (o4 24.6%) voted for Trump. Additionally, the highest frequency of voting in the 2016 election was given to the independent party
candidate, with 811 people (or 14.5%) of respondents voting for them, and 87 Americans (or 3.7%) of respondents voted for a different, unspecified candidate. Though we are
mainly focusing on whoever voted for Clinton or Trump, due to the political stigma and gender relations and platforms each candidate ran on, it is still important to recognize
that the majority of the sample did not vote for either Clinton or Trump and therefore should be considered when cross referencing data to look at the relationships that exist.
Now that there is an understanding of how each variable can be broken down separately, we observe the relationship between the independent and dependent variables.
As seen in table 2.2, out of 946 American adults, the majority of respondents who agreed that women were not suitable for politics had voted for Trump with 18.5% of
the sample, in contrast to only 9.4% of Clinton voters who agreed with that statement. Inversely, the majority of people who disagreed with the statement were Clinton
voters, with 90.6% of the sample, whereas the Trump voters who disagreed with the statement consisted of 81.5% of the sample. The other two categories in the 2016
presidential election variable, “other candidate” or “did not vote” show that the majority of the respondents disagree with the statement that women are not suitable
for politics in both categories. Additionally, by running a chi-square test, with a chosen alpha of 0.05, the p-value comes to 0.00, meaning that this association
between the two variables is very statistically significant. Further, when conducting Gamma and Kendall’s Tau-b tests, they result (from a range of 0 to -/+1) in
-0.231 and -0.084, meaning that the relationship that is shown between the two variables is negative but not very strong. Nevertheless, here we can see that there
is a significant statistical association between who respondents voted for in the 2016 election, and whether they believe that women are suitable for politics.
Again, we do see the universal trend of the majority of respondents disagreeing with the statement about women in politics, yet there is a change in the data when
cross referencing the 2016 election.
I went one step further to analyze the relationship between the dependent and independent variables by cross referencing them with three coefficients: sex, race
and degree. Starting by analyzing how sex has an impact on both the 2016 election voting choices and attitudes towards women in politics. In our sample, as displayed
in tables 3.1 and 3.2, out of 2,348 adult Americans, 1,052 individuals (or 44.8%) identify as male, and 1,296 (or 55.2%) identify as female. In a bivariate table displaying
the statistical relationship between sex and votes for Clinton or Trump, the data shows that the majority of men voted for Trump with 45.8% of the sample, and 45.3% of men
voting for Clinton. Inversely, women were more likely to vote for Clinton, with 59.2% voting for her while only 34.7% of women voted for Trump. This shows that women felt
more strongly about voting for Clinton over Trump, whereas, though there was a majority of men voting for trump, there was only a 0.5% difference between men who voted for
Trump over those who voted for Clinton. After running a chi-square test, assuming an alpha of 0.05, the p-value resulted in 0.00, meaning that the statistical differences
in voting habits among the sex’s is statistically significant and we can reject the null that there is no relationship between the two variables.
Similarly, when cross referencing this bivariate table in table 3.3 with attitudes toward women being suitable for politics, we can see that there is in fact statistically
important information found here. Starting among males who voted for Clinton, only 9.6% of respondents agreed with the statement that women are not suitable for politics,
whereas 90.4% disagreed with the statement. Out of those who voted for Trump, 17.1% of men agreed with the statement, whereas 82.9% of males disagreed with the statement.
This means that despite one’s presidential choices, a large majority of men disagreed with the statement that men are more suitable for politics than women. Nevertheless,
there is a 7.5% difference between Clinton and Trump supporters who do agree with the statement, which is statistically significant proven by the chi-square test that
resulted in a p-value of 0.04.
Women, on the other hand, had an even more statistically significant difference between Clinton and Trump supporters who agreed or disagreed with the statement that women
are not suitable for politics. Among females who voted for Clinton, 9.2% agreed with the statement, whereas 90.8% disagreed. Women who voted for Trump, though, consisted of
20.1% of those who agreed that women were unsuitable for politics, whereas 79.9% disagreed with the statement. Much like the statistical trends among men, women wholistically
disagreed with the idea that women were unsuitable for politics, yet there was an even greater difference between those who agreed with the statement among Clinton supporters
and Trump supporters. Between Clinton and Trump supporters that agreed with the statement, there was a 10.9% difference, which is quite large. This significance is also proven
by the chi-square test that results in a p-value of 0.00, meaning that we can reject the null that there is no association between the three variables.
Overall, we can see that within the variable “sex” there is a statistically significant relationship between the independent and dependent variables. We also can see that there
is a similar pattern in responses between men and women and their voting habits, but there is a greater and more significant difference among women.
The second constant that I tested was the variable “race,” which, as seen in table 4.1, consists of 2,348 adult Americans, broken down into three categories: “white,” “black,”
and “other.” These categories consist of 1,693 white people, 385 Black people and 270 individuals who identify as “other.” The potential problem with this sample is firstly, the
number of people who identify as something other than white are much smaller than the white category, therefore possibly not giving enough information to make a statistical
conclusion about the population. Further, the categories themselves are incredibly reduced and vague compared to an entire population which has far more than three races,
therefore also altering the accuracy of the sample reflecting the true opinions of the population.
One relationship that was statistically significant, as seen in table 4.2, is between identification of race, and who respondents voted for in the 2016 election. Here, we can
see that white respondents were far more split between Clinton and Trump, and in fact have a majority of individuals (or 49.6%) who voted for Trump, in contrast with 42.2% of
the sample as Clinton supporters. Among Black individuals, a great majority of respondents (or 94%) reported voting for Clinton, whereas only 2.4% of Black respondents voted for
Trump. Finally, within the “other” category, there was still a large majority of respondents who voted for Clinton, with 66.7% of the sample, and only 25% who voted for trump.
We can corroborate the statistical significance of these findings with a chi-square test that resulted in a P-value of 0.00, meaning that we can reject the null that there is no
association between race and who the sample voted for in the 2016 election.
Unlike the variable “sex,” there was not enough of a statistical significance within the association between race and opinions on women in politics, besides among white people
as seen in tables 4.3.1 and 4.3.2. This could be attributed most likely to the limited size of the individuals among the “Black” and “other” categories. For example, only 2
individuals who identified as Black voted for Trump, and among them, one agreed with the statement that women are not suited for politics, and one disagreed. Among the white
respondents, the majority disagreed that women are not suited for politics, though there is about a 10% difference between Trump and Clinton voters. Among Clinton voters, 9.1%
agreed with the statement, whereas 90.0% disagreed. Similarly, 18.4% of Trump supporters agreed that women are not suitable for politics, whereas 81.6% disagreed. This is all to
show that there are slight associations between the independent and dependent variable and race when referring to White respondents specifically. Additionally, among that group,
there are similar trends of disagreeing that women aren’t suitable for politics, yet there are differences in those numbers between Trump and Clinton supporters.
My final coefficient that I used to test these associations was with “degree,” or highest amount of schooling achieved among the sampled individuals, as seen in table 5.1.
In table 5.2, we can see the relationship between degree and attitude toward women in politics. Here, it is clear that across all categories (ranging from less than a highschool
degree to graduate degree), the majority of people disagree with the statement that women are not suitable for politics. Nevertheless, there is an increase of those who disagree
with that statement as the respondents rose in their level of education. For example, for sampled individuals who achieved less than a high school degree, 19.2% agreed that women
were unsuitable for politics, whereas 80.8% disagreed. The number of respondents who disagreed with the statement continued to rise, finalizing with those who have achieved a
bachelor’s degree, with 7.7% agreeing and 92.3% disagreeing with the statement. After conducting a chi-square test, we can see that this is statistically significant as the test
resulted in a p-value of 0.001, when assuming alpha is 0.05. The only inconsistency here is a slight decrease between those who disagree that women are not suitable for politics
between those who have completed a bachelor’s degree versus those with a graduate degree.
When looking at the relationship between degree and who respondents voted for in the 2016 election, there is an interesting trend that occurs here, seen in table 5.3. Though the
majority of respondents across all levels of education voted for Clinton, with only a slight decrease in Trump voters as education levels rise, the most interesting part of the
data is within the “other candidate” category. Among respondents who had not finished high school, only 2.2% voted for a different candidate other than Clinton or Trump. Out of
those with a high school degree, 5.6% voted for a different candidate, and among college graduates, 8.5% voted similarly. This shows that as people become more educated, they are
more likely to vote for an alternative candidate. This significance is corroborated by a chi-square test resulting in a P-value of 0.030, with an alpha of 0.05.
Finally, when creating a bivariate table that cross references degree with the 2016 election and opinions of women in politics, as seen in table 5.4.1 and 5.4.2, there are several
significant observations to be made. Starting with respondents whose highest level of degree is high school, both Clinton and Trump voters were more likely to disagree that women
are not suited for politics, yet among Clinton voters, 12.3% agreed with the statement whereas 22.1% of Trump voters agreed with that statement. We can see that though voters overall
were more likely to disagree with women being unfit for politics, there was a 9.8% difference among those who agree with the statement depending on who they voted for in the 2016 election.
That means that Trump voters whose highest degree was high school are more likely to agree with the statement than Clinton voters. We see the exact same trends among those who completed
graduate school, except there is a greater difference among Clinton voters who agree and disagree with women being unsuitable for politics than Trump overs of the same categories.
For example, among Clinton voters who only had a high school degree, 12.3% of that group agreed with that statement, whereas among Clinton voters with a graduate degree, only 4.1% of
that group agreed that women are not suitable for politics. Further, that shows a greater difference between the graduate degree sample who voted for Clinton versus Trump, as 21.4% Trump
supporters agreed with the statement, meaning that there is a 17.3% difference which is quite large. Again, with a chi-square test assuming an alpha of 0.05, the statistics around the
sample whose highest level of education is high school had a p-value of 0.005, and the data associated with the sample with a graduate degree resulted in a p-value of 0.012, both of which
show that there is statistical significance in these observations and relationships with opinions of women in politics and political voting trends of the 2016 election.
CONCULSION AND DISCUSSION
After analyzing the statistical data surrounding my research question, there are trends that I expected, and others that I am surprised about. Where I originally
had hypothesized that individuals who voted for Donald Trump are more likely to think that women are not emotionally equipped for politics, I was surprised to find
that consistently across all political parties, individuals were more likely to disagree that women are not suited for politics. Though I assumed that due to the
liberalization of mindsets around women in the working world over time would result in a higher number of the sample to disagree with the statement that women are not
suitable for politics, I was quite surprised at the amplitude of respondents that disagreed across all parties, sexes, races, and degrees. I also thought that due to
Trump’s blatant and open sexism, that his supporters would hold or agree with the same sentiments, which was shown at a very small amplitude in the data. Though there
were higher numbers of people who agreed that women were unequipped for politics and voted for Trump rather than those that agreed and voted for Clinton, nevertheless,
it surprised me that there was not a larger division. Furthermore, when analyzing the constants, we could see that sex also played a role in determining one’s opinion
of women in politics. I hypothesized that men would be more likely to think they are more emotionally capable of a political career than the opinion of women. Though men
were ever so slightly more likely to agree with that statement among Clinton supporters, Trump supporting women were more likely to agree that women are unfit for
politics than Trump supporting men! This is incredibly interesting yet not surprising. Women who deliberately chose to vote for Trump over Clinton are more likely to
be focused on gender politics and have a stronger opinion on the issues around sex that the candidate raises. The least conclusive constant that was tested was race,
which is not what I predicted. The data showed that though there was statistically significant information among white individuals, yet respondents that identified as
Black and “other” have such a small sample size, it is hard to determine whether the statistical insignificance of that data is accurate. Finally, degree also had slight
associations with the dependent variable. It can be noted that across all levels of education, the majority of respondents disagreed that women are not suited for politics,
yet as individuals increased their level of education, they were also less likely to agree with the statement. Overall, we can observe that political affiliation, sex, race
and degree of the surveyed individuals does have an effect on their opinions of whether men are more emotionally equipped for a profession in politics than women, there are
just different strengths of relationships among each variable.
In the future, I would have liked the sample sizes to be bigger and more accurately representative of the population. Especially in regard to race, it was practically impossible
to make accurate conclusions with a sample size lower than ten. I think that in the future, the research could be taken into far more detail to really understand the nuances of
each variable. For example, the dependent variable question asks if men are more emotionally capable of a profession in politics than women. This can be developed into several
different specific questions, not necessarily in comparison to men, but about women in politics in general. In addition, I think that honing in on the nuances of how different
sexes view specific political platforms or political topics in regard to women in politics would be a valuable trajectory for future research.
In conclusion, the results of the data support the background and theory surrounding attitudes toward women in politics. Though the results show that the majority of the sample does not
agree that women are unsuitable for politics, there still is a part of the sample that does believe in that statement. These majority trends can be explained by society becoming more
liberal and accustomed to women in the workplace, yet the existence of people agreeing with women being unsuitable for politics plays directly into women being seen as the other in society.
Furthermore, when cross-referencing this variable with the 2016 election, the statistical results parallel the candidates’ platforms well. Especially because the 2016 election was strongly
focused on the identity politics of the two candidates, Clinton being potentially the first female president, this was an influential variable to test opinions on women in politics.
This means that though society has a strong majority holding positive and encouraging views on women in politics, stigmas around gender and politics continue to exist, especially when
cross referenced with certain parts of one’s identity and social environment.
BIBLIOGRAPHY
-Cavazza, N., Pacilli, M.G. 2021 “Is Politics Still a Masculine Thing? Stereotypical Male Description Activates the Prototype of the Politically Committed Individual Worthy of a Vote.” Sexuality & Culture, 25,
1076–1095. https://doi.org/10.1007/s12119-020-09810-9
-Crowder-Meyer, M., Gadarian, S. K., & Trounstine, J. 2020. “Voting Can Be Hard, Information Helps.” Urban Affairs Review, 56(1), 124–153. https://doi.org/10.1177/1078087419831074
-De Beauvoir, S., 1956. The Second Sex. London: Lowe and Brydone, pp.13-29.
-Deckman, Melissa and Cassese, Erin. 2021. “Gendered Nationalism and the 2016 US Presidential Election: How Party, Class, and Beliefs about Masculinity Shaped Voting Behavior.” Politics & Gender 17(2):277–300.
https://www.cambridge.org/core/journals/politics-and-gender/article/gendered-nationalism-and-the-2016-us-presidential-election-how-party-class-and-beliefs-about-masculinity-shaped-voting-behavior/1F3F3AC0CBEA6F4AC4D89C4CA1FF8409
-Lynch, F.R. 2019. “How Did this Man Get Elected? Perspectives on American Politics, Populism and Donald Trump.” Society 56, 290–294. https://doi.org/10.1007/s12115-019-00366-5
-Plutzer, E., & Zipp, J. F. 1996. “Identity Politics, Partisanship, and Voting for Women Candidates.” The Public Opinion Quarterly, 60(1), 30–57. http://www.jstor.org/stable/2749497
-Valentino, N. A., Wayne, C., & Oceno, M. 2018. “Mobilizing sexism: The interaction of emotion and gender attitudes in the 2016 US presidential election.” Public Opinion Quarterly, 82(S1), 799-821. https://doi.org/10.1093/poq/nfy003
TABLES & FIGURES
I. Dependent Variable: FEPOL
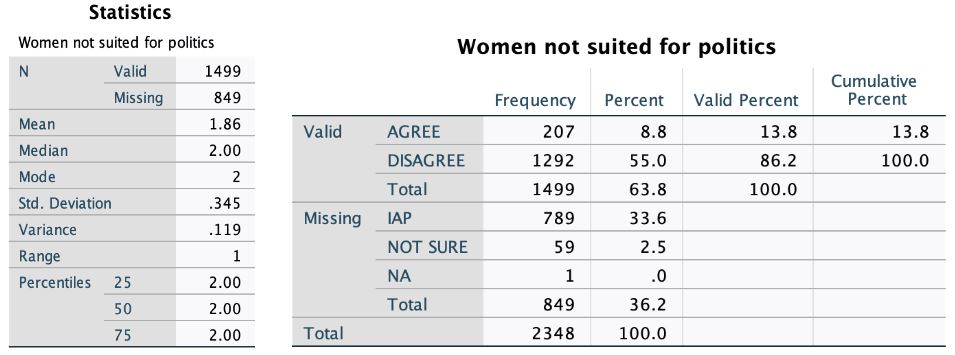
Table 1.1 shows the statistical data from the variable FEPOL, which describes the question above
analyzing gender and politics
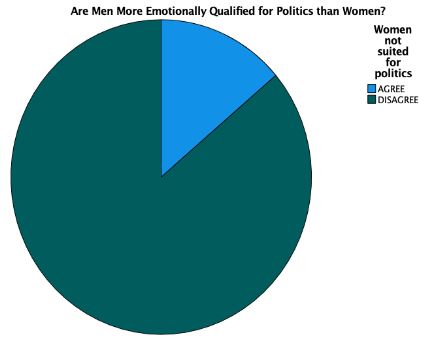
Figure 1.2 Pie chart from FEPOL data
II. Independent Variable: PRES16
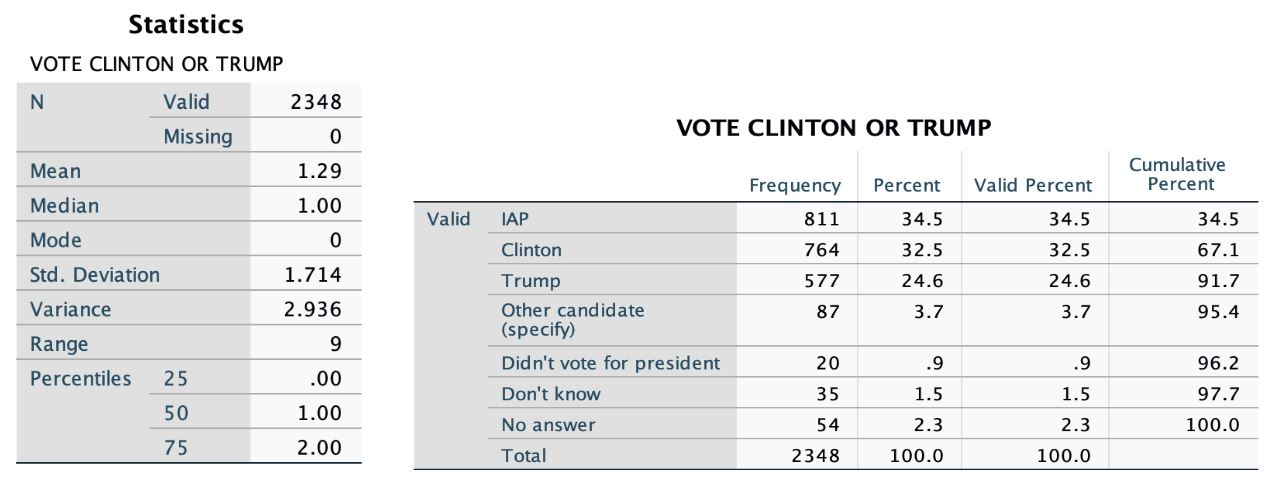
Table 2.1 is the descriptive statistics of PRES16, or the sampled population who voted for either Trump,
Clinton or IAP
DV and IV Combined
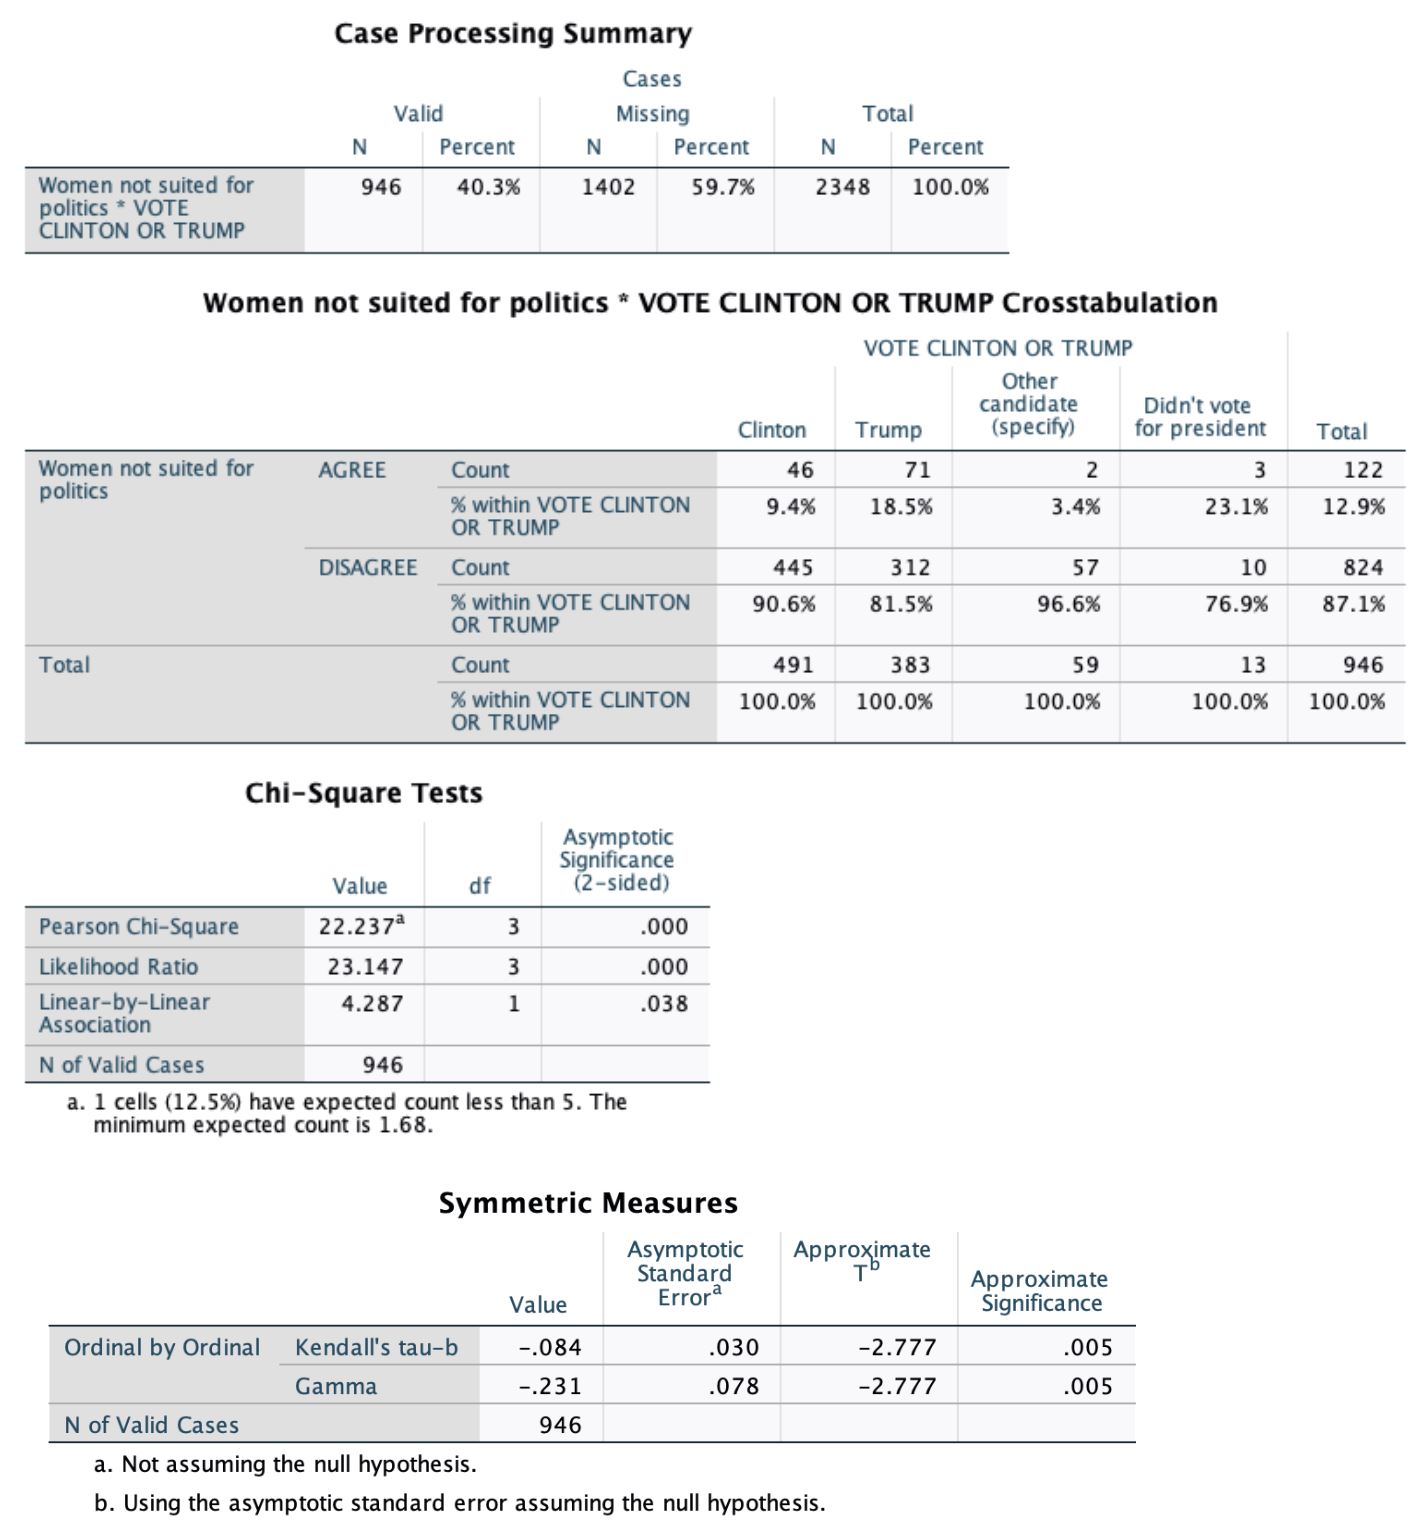
Table 2.2 Bivariate table, chi-square test, and Gamma and Kendall’s Tau-b tests of relationship
between voting in the 2016 election and attitudes toward women in politics
III. Constant: SEX
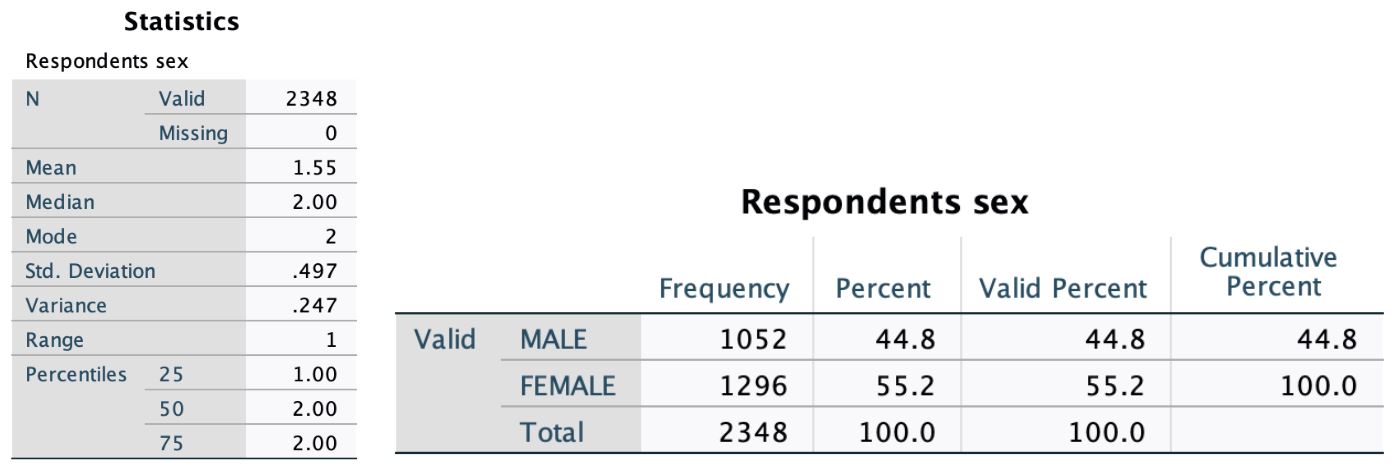
Table 3.1 shows the statistical information of the variable “SEX” regarding the sex of the sample
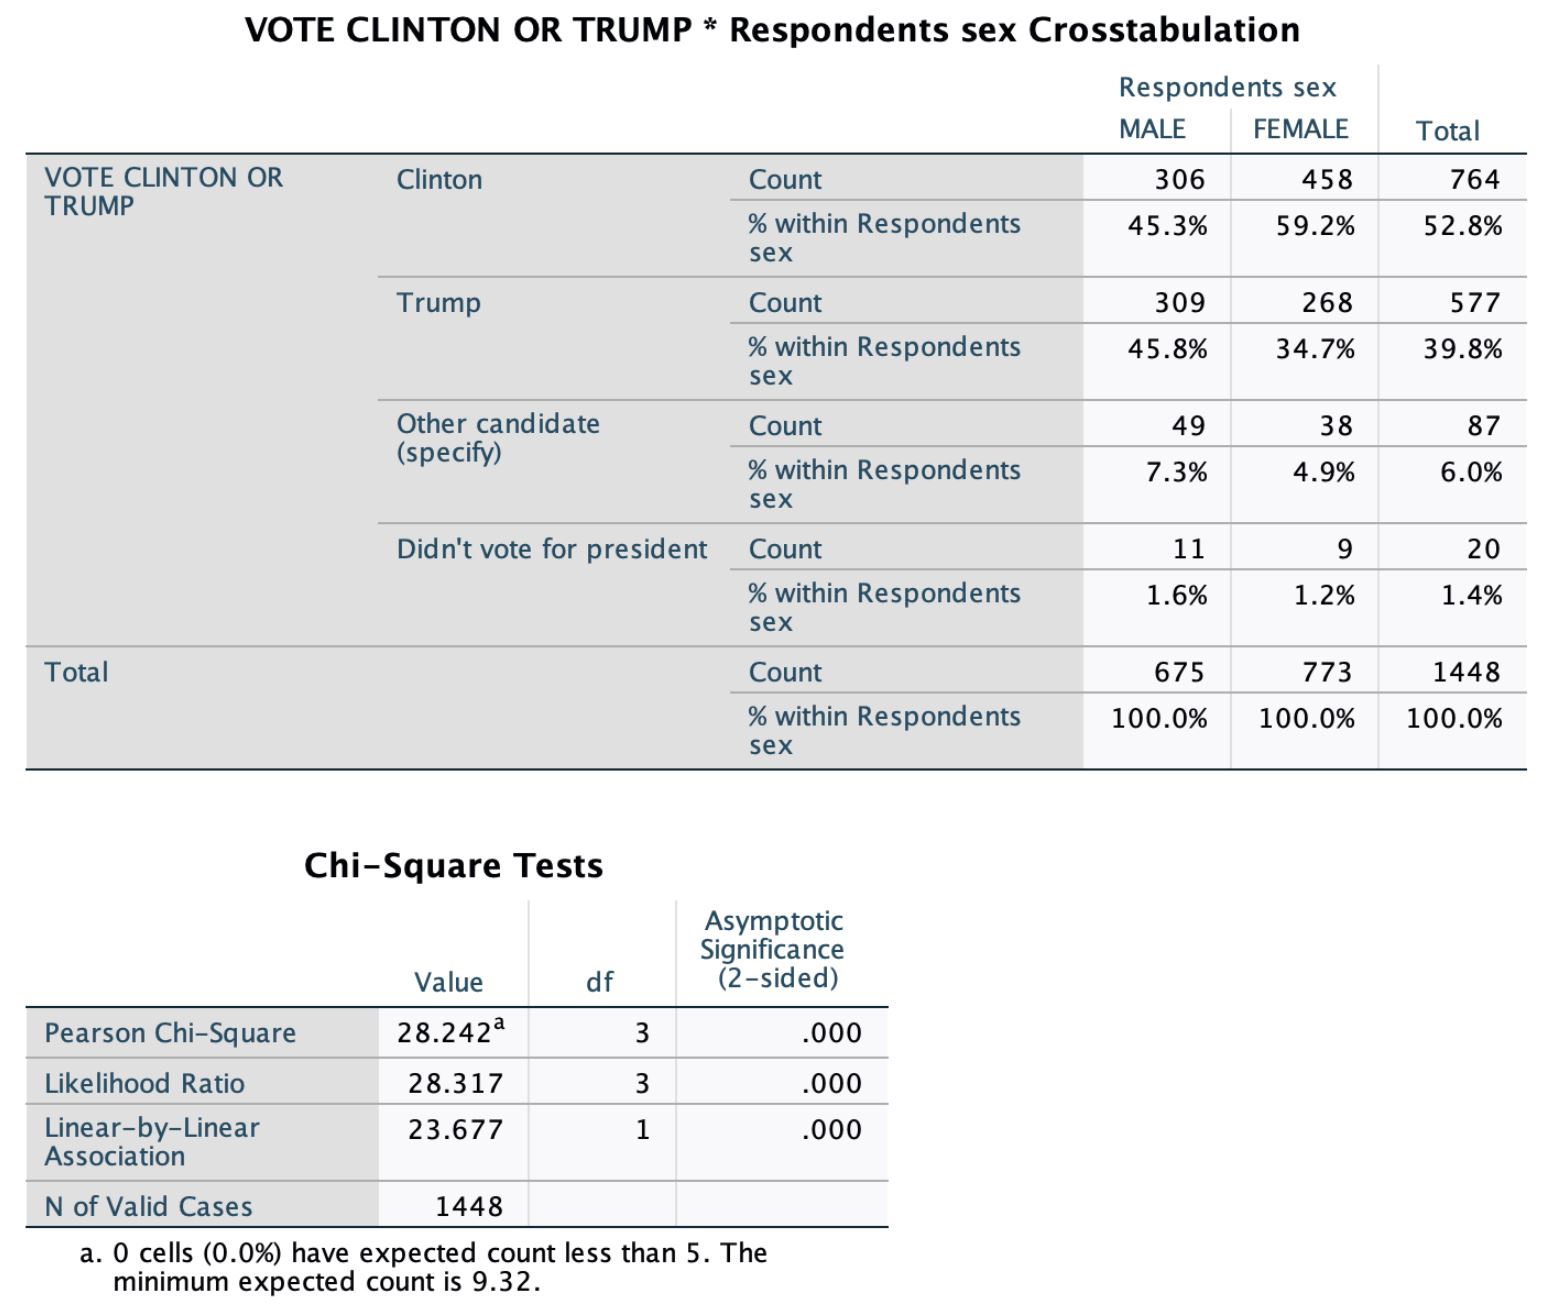
Table 3.2 Bivariate table and chi-square test showing the statistical relationship between
voting in the 2016 election and sex
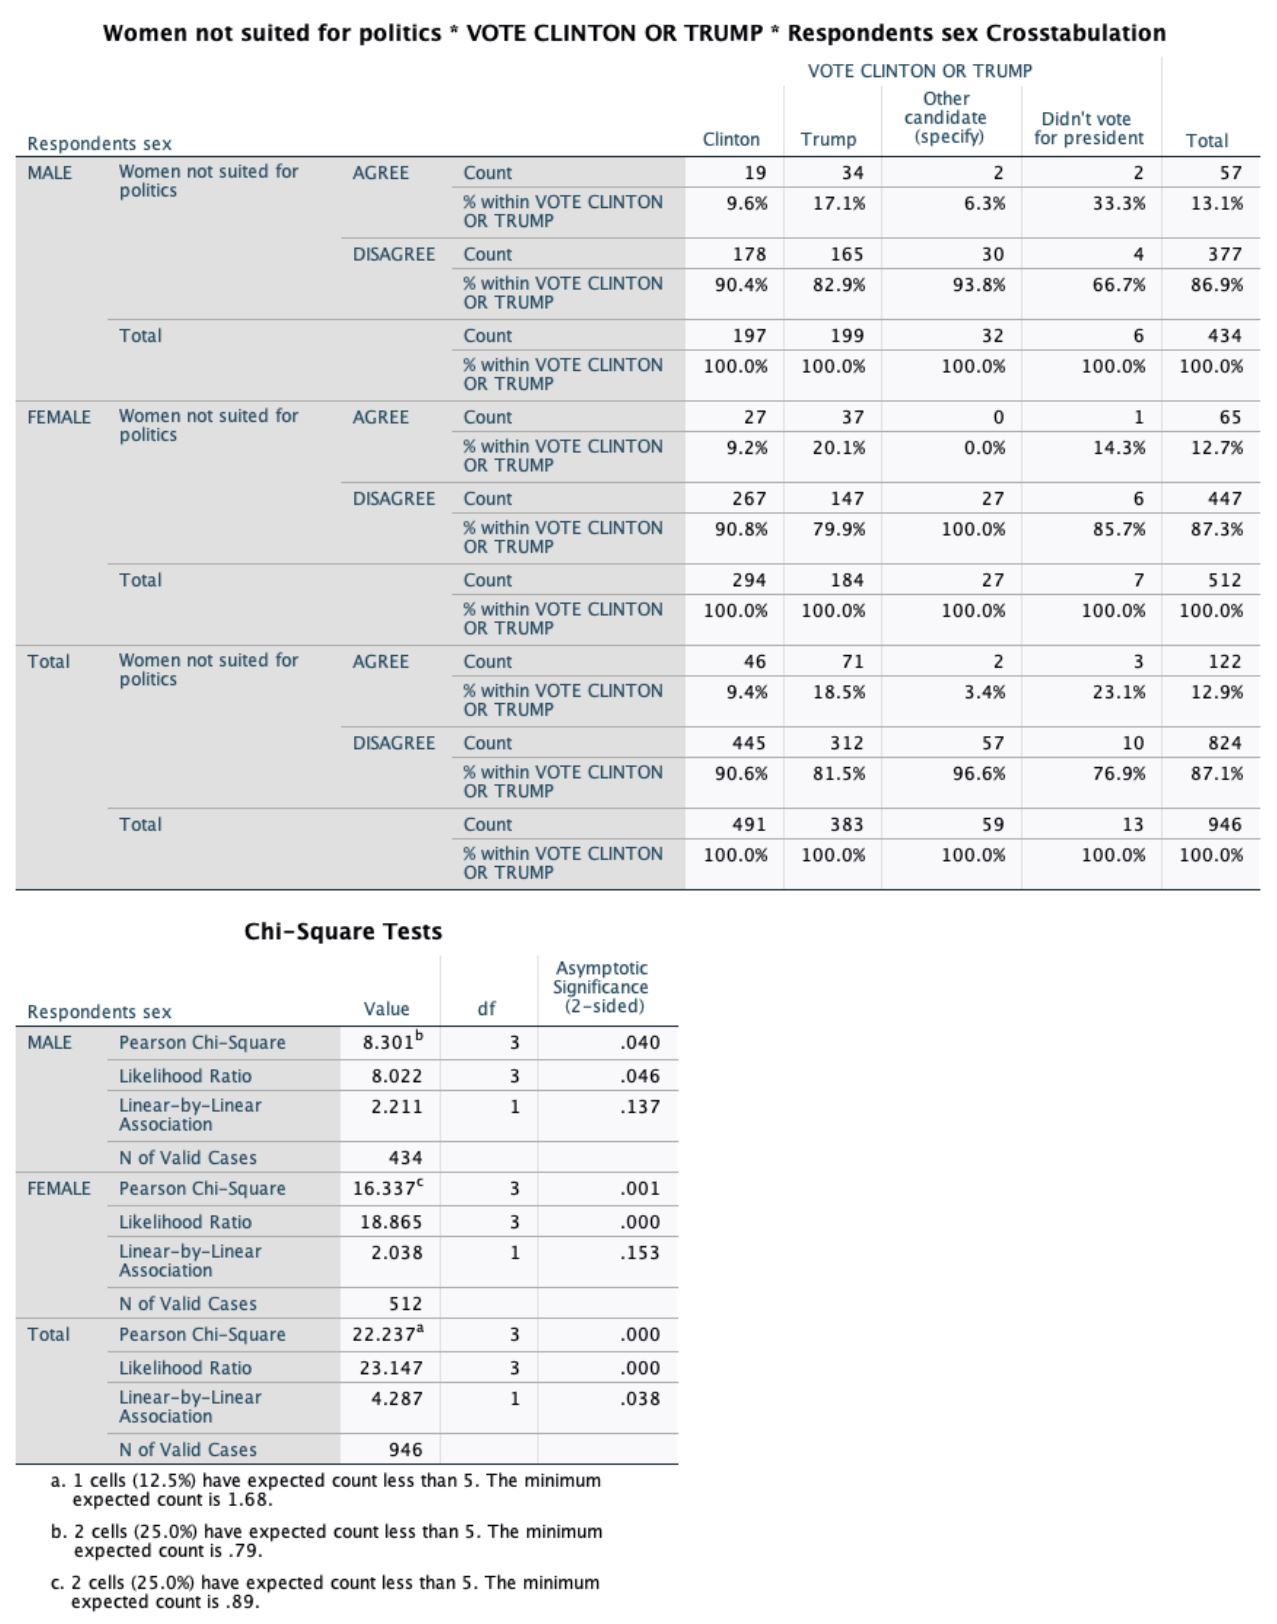
Table 3.3 Bivariate table and chi-square test showing the relationship between attitudes
around women in politics and 2016 election votes separated by sex
IV. Constant: RACE
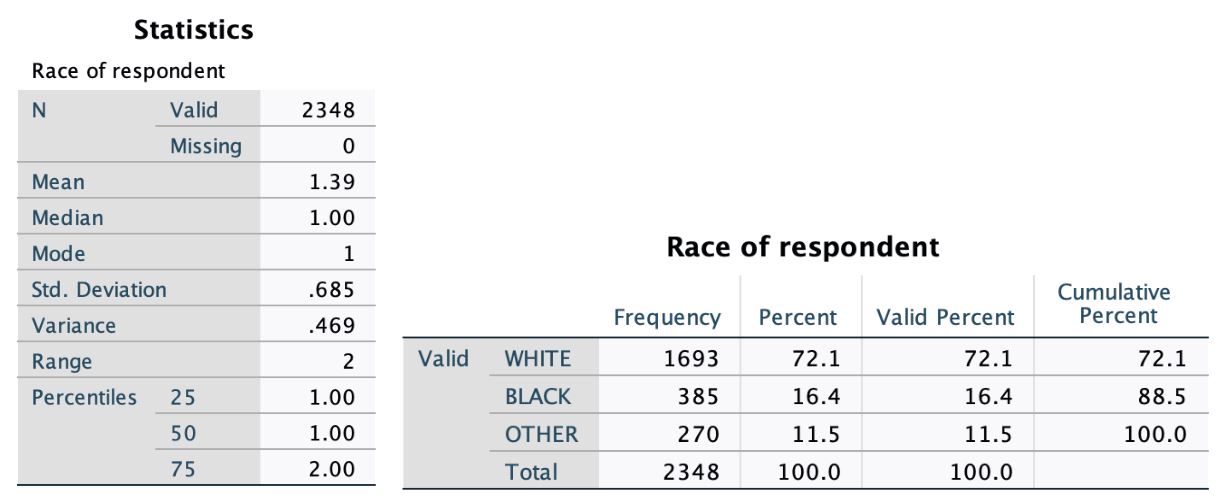
Table 4.1 shows the statistical information of the variable “RACE” or the race of the sample
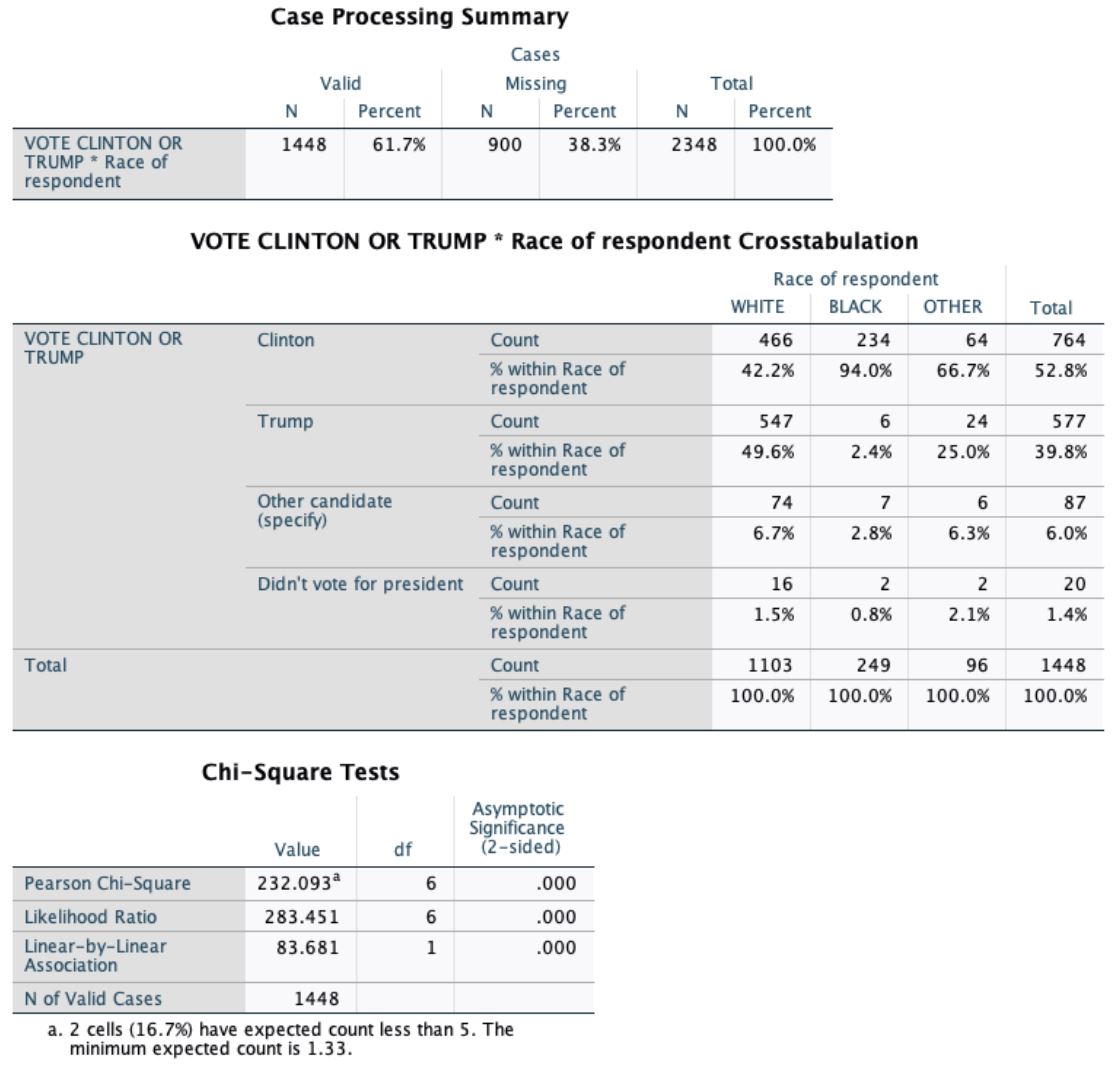
Table 4.2 Bivariate and chi-square test showing the relationship between race and respondent’s
voting choice in the 2016 presidential election
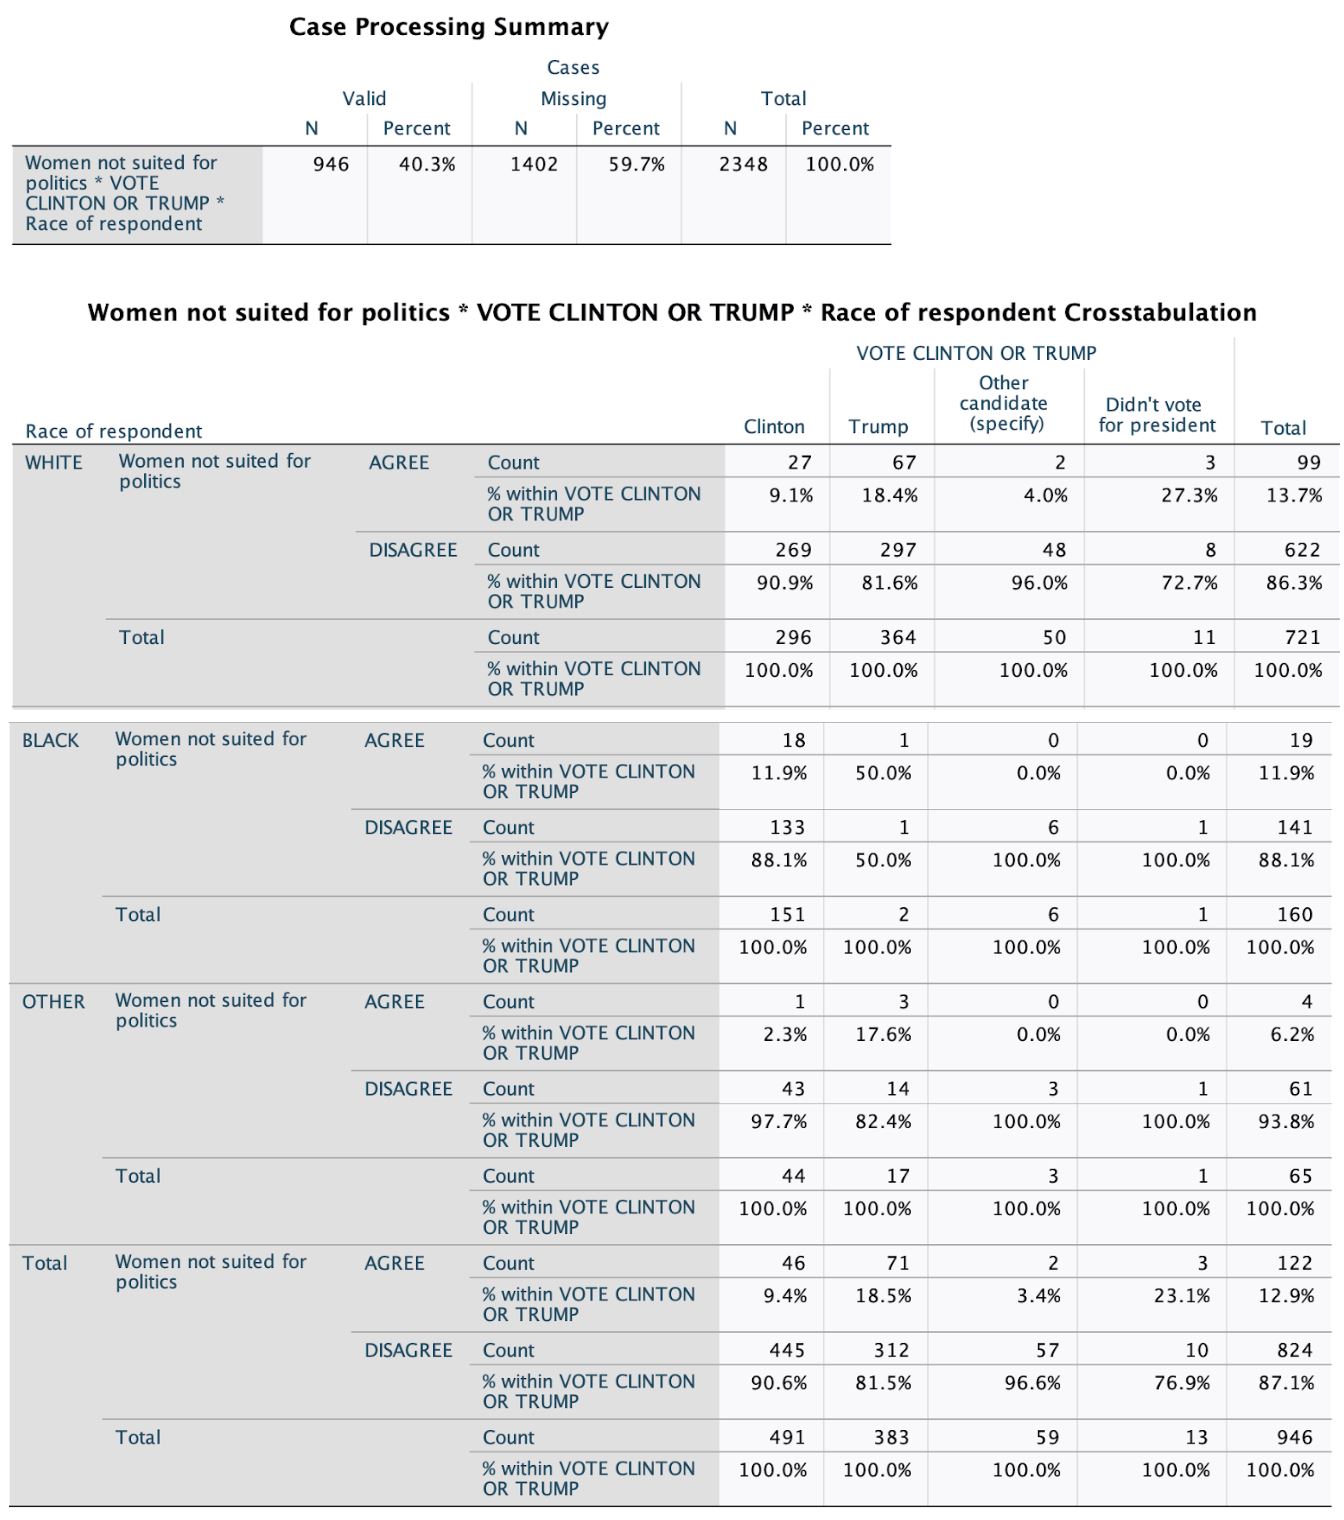
Table 4.3.1 Bivariate table showing relationship between attitudes toward women in politics
and results of 2016 presidential election, separated by race
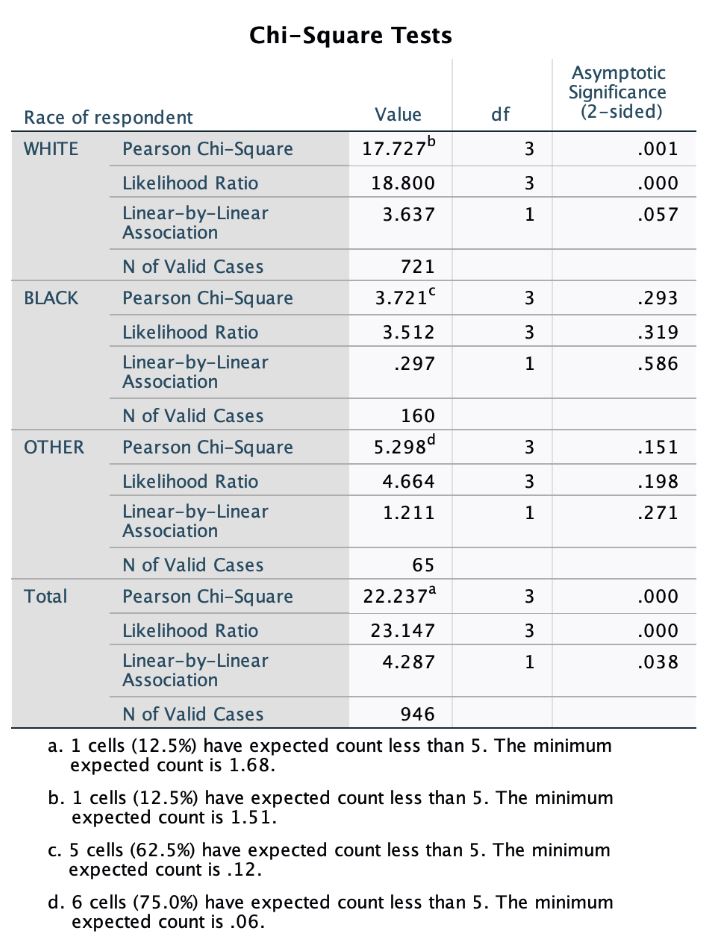
Table 4.3.2 Chi-square showing relationship between attitudes toward women in politics
and results of 2016 presidential election, separated by race
V. Constant: DEGREE
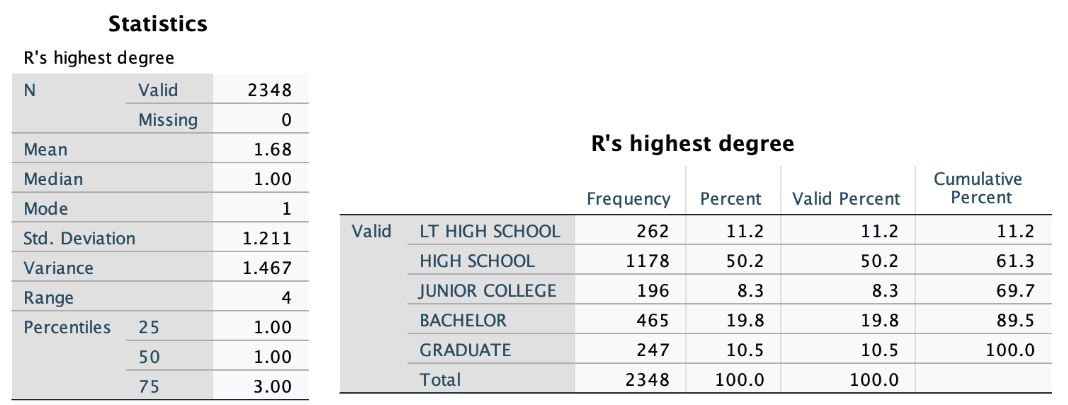
Table 5.1 Bivariate table and chi-square test displaying the association between degree and attitude
toward women in politics
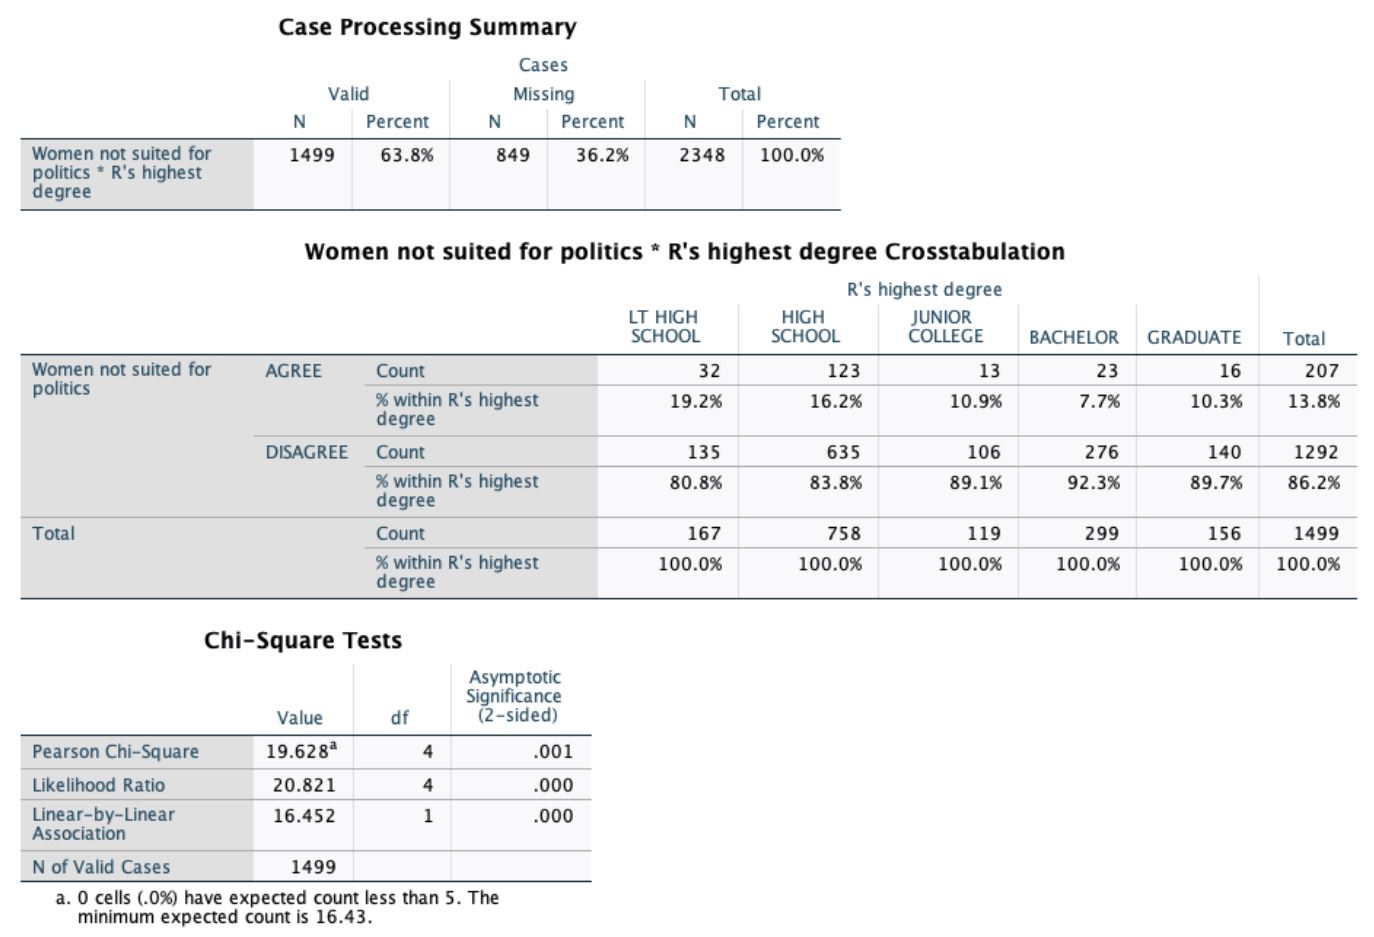
Table 5.2 Bivariate table and chi-square test displaying the association between degree choice in the
2016 presidential election
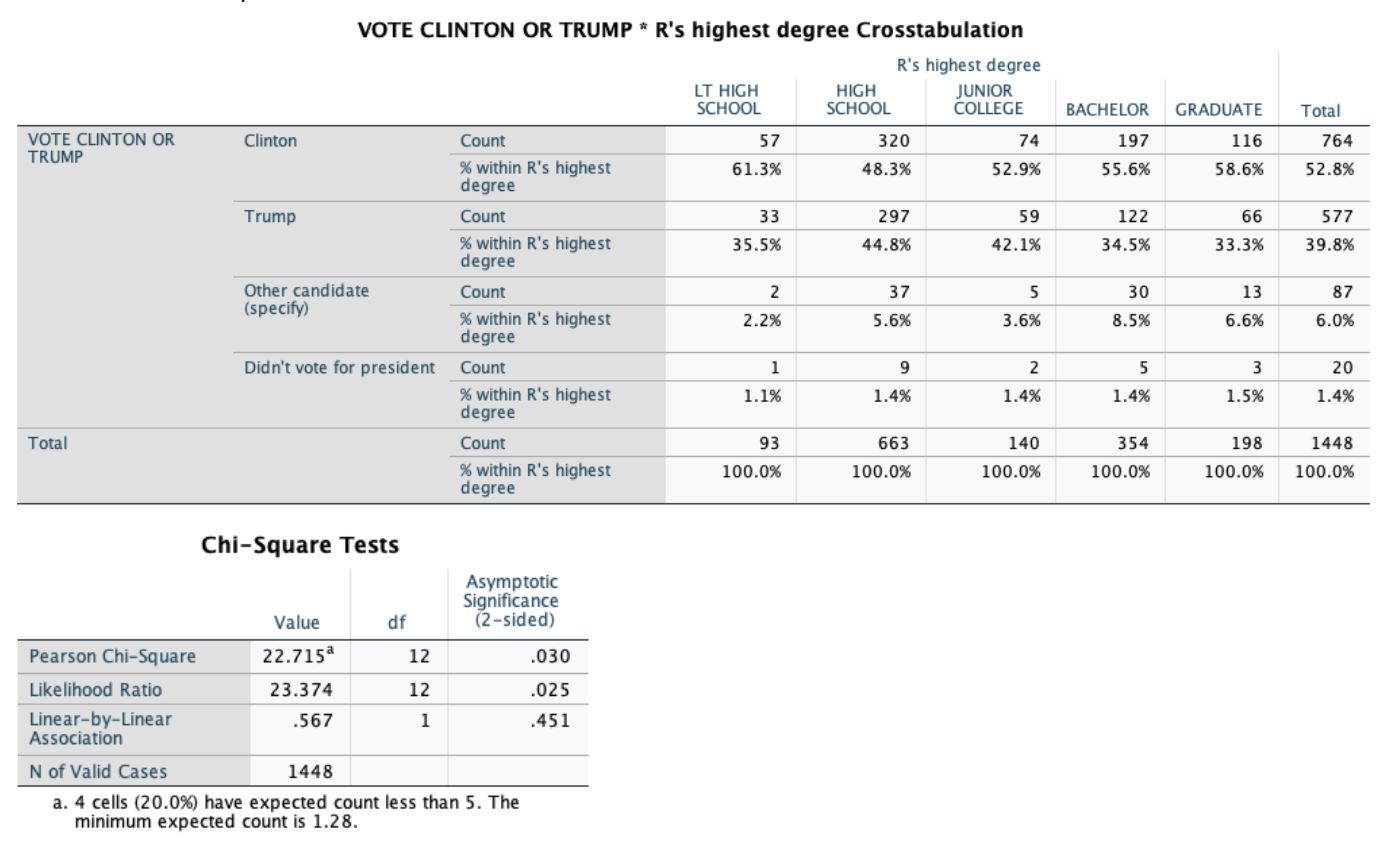
Table 5.3 Bivariate table and chi-square test displaying the association between degree
and who respondents voted for in the 2016 election
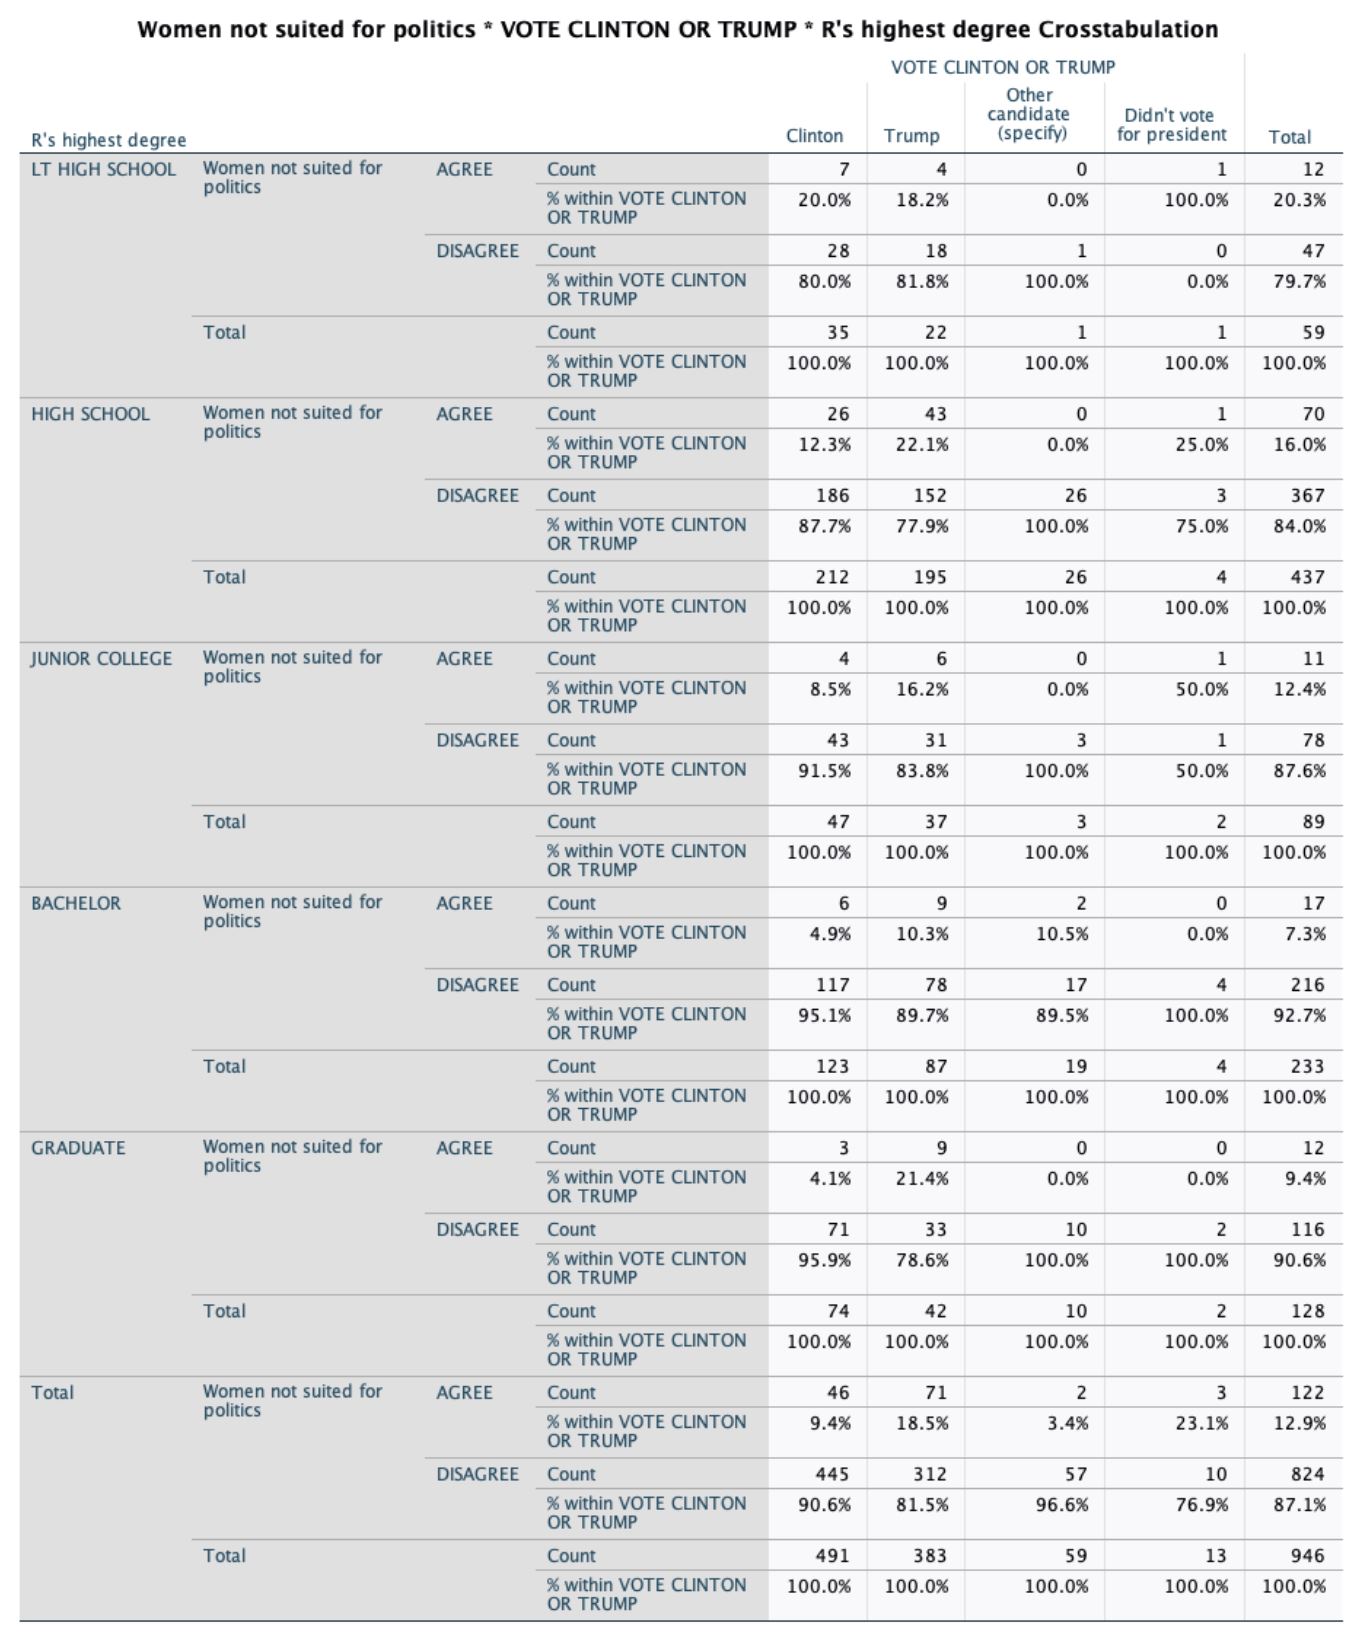
Table 5.4.1 Bivariate table displaying the association between respondent’s vote for Clinton or Trump
and attitude toward women in politics, broken down by degree
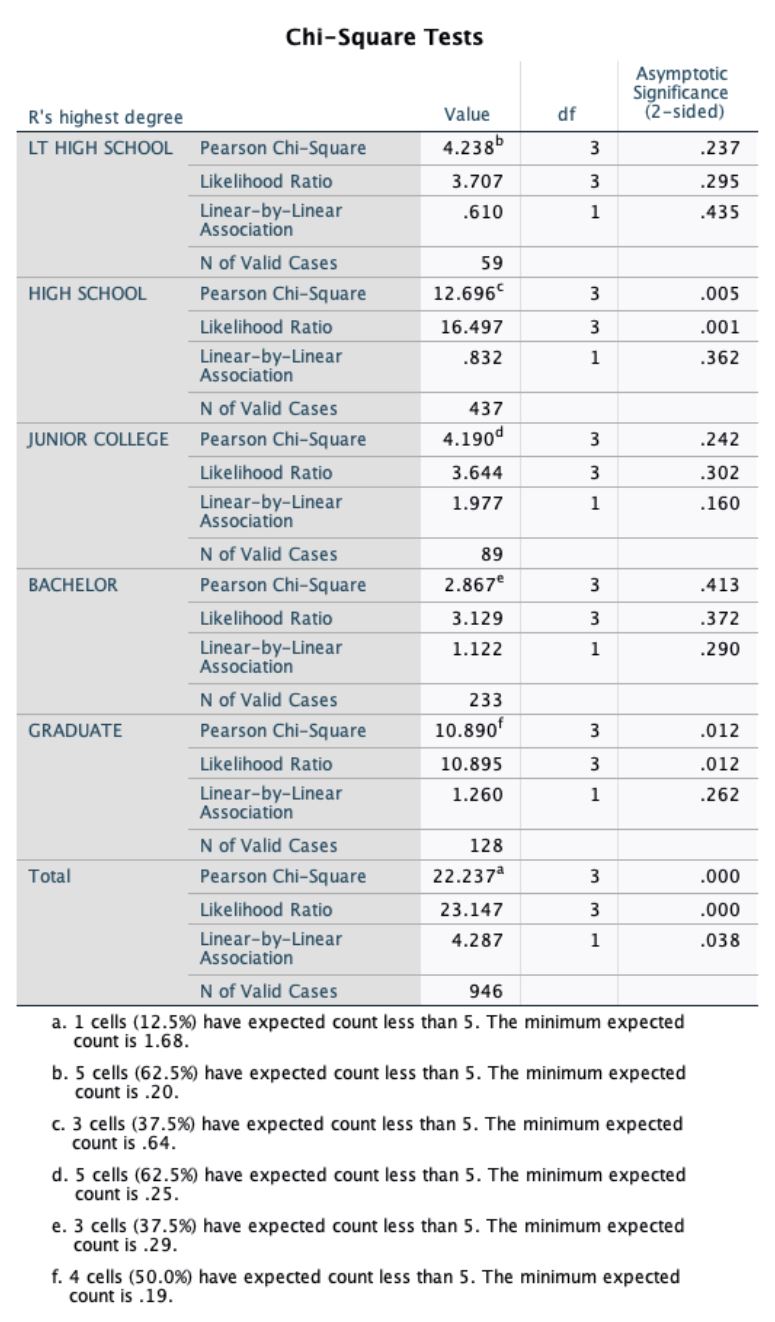
Table 5.4.2 Chi-square test displaying the association between respondent’s vote for
Clinton or Trump and attitude toward women in politics, broken down by degree